Omnichannel Brand Lift: why there’s no single best channel mix

Omnichannel Brand Lift: why there’s no single best channel mix

Brands are activating across more channels than ever, but most brand lift studies still score each channel on its own. That leaves a crucial question unanswered: do these channels work better together than apart? As media plans add channels, the gap between joined-up activation and proof gets harder to defend.

Whether you can answer that depends less on the channels than on how you measure them.

A study built channel by channel can tell you which channel performed best. Only a study built across channels, using cross-platform advertising measurement, can tell you whether they performed better together, and whether the best combination changes with the objective. Below, we set out what each measurement approach can see, what it takes to measure synergy, and what happened when we tested it on a live campaign.

Multi-channel, cross-channel, omnichannel: why the difference decides what you can measure

These three terms get used interchangeably. They shouldn’t be, because each one implies a different measurement model, and only some of those models can see synergy at all.

Approach How channels are activated What measurement can see
Multi-channel
Present on several channels, each planned, run and measured in isolation
Each channel’s lift on its own, with no view of how channels interact
Cross-channel
A selected set of channels integrated through shared data and joined-up reporting, not necessarily every channel
Combined lift across that set, and whether specific combinations outperform their parts
Omnichannel
Reverses the logic: organised around the customer rather than the channel, which in practice means the full relevant channel set, integrated
Lift across the whole mix, and which combinations drive it

That distinction matters because measurement inherits the structure of the activation.

Single-channel and multi-channel studies score each channel separately, by design. There is no mechanism for spotting one channel lifting another. If CTV builds familiarity that makes an audio spot land harder, a siloed study splits that credit between two reports or loses it entirely.

Cross-channel and omnichannel measurement are the only approaches positioned to ask whether a combination is worth more than the sum of its parts. Put simply, for multichannel marketing and beyond, the measurement method has to match the activation strategy.

Industry usage of these terms varies, with some definitions built on channel count and others on customer-centricity; these are the working definitions for this article, not a ruling on that debate.

What it takes to measure channel synergy

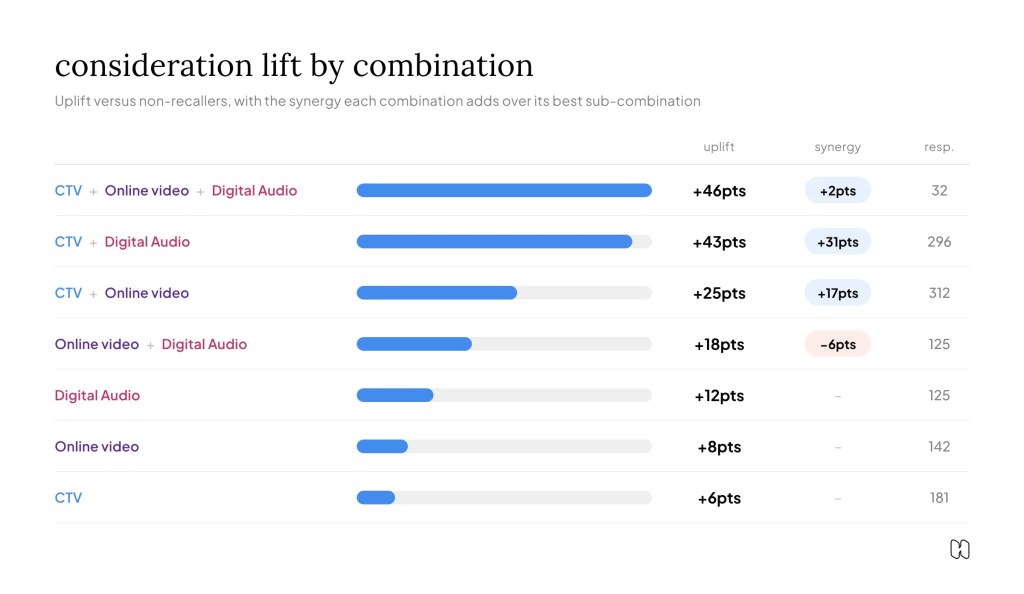
Standard brand lift reporting can rank channels against each other. It can’t isolate synergy. Run a separate study per channel and each one has its own sample, its own timing and its own control group. Line four of those up side by side and you can say which channel did best. You can’t say whether a combination of three did better than the strongest of them alone, or by how much.
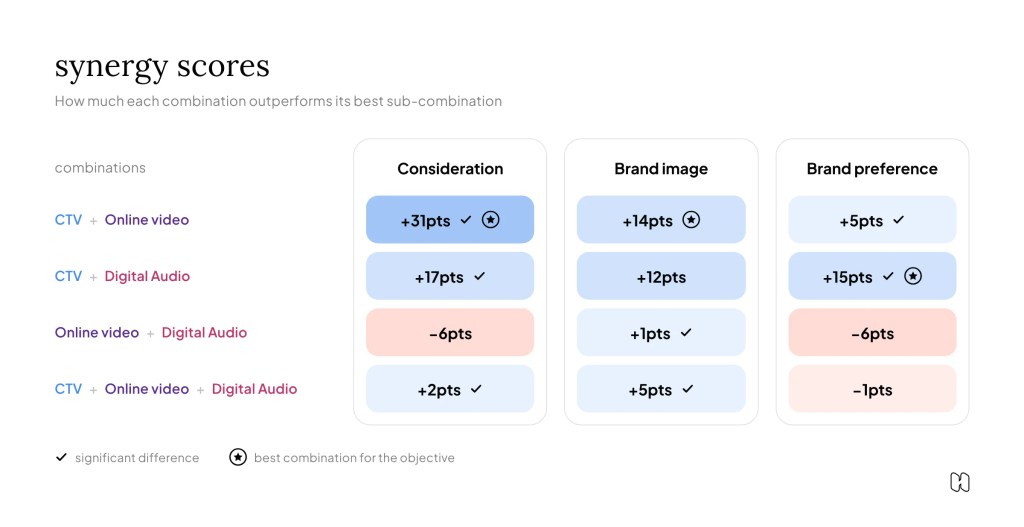
Measuring synergy takes three things:

  1. One survey across every channel. A single survey covering the full channel mix means respondents can be grouped by the combination of channels they actually saw, and every group compared against the same matched control. Everyone answers the same brand questions, so outcomes compare directly across groups.
  2. A control based on ad recall. Instead of comparing everyone served an ad with everyone who wasn’t, compare people who recall the ad with a matched group who don’t. That ties lift to ads that actually registered with people, not just ads that were delivered.
  3. A benchmark to read results against. Measure each channel and channel combination against a benchmark, so a lift figure can be judged in context, not in isolation.

With these three things in place, you can measure synergy against any objective across the funnel, from awareness and consideration through to preference and intent. This reveals which channel combinations work best for each objective, and where channels deliver more impact together than they do alone.
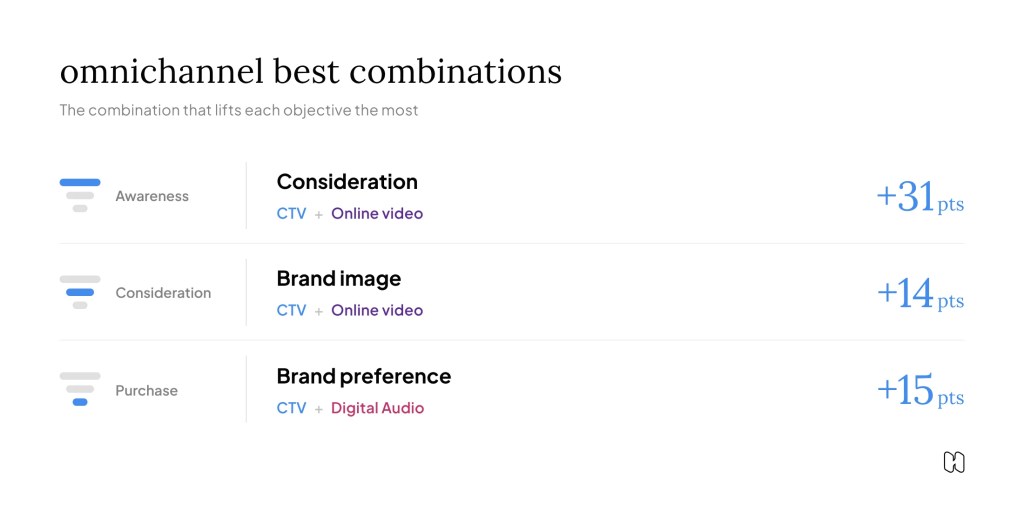
Ahead of our omnichannel brand lift launch in Q1 2027, we put this approach to work on a live campaign with The Trade Desk and Disney+ in France.

The test case: The Trade Desk × Disney+

What was tested

Disney+ France wanted to maximise brand impact through the competitive 2025 holiday season, and to learn which channel combinations delivered the strongest brand outcomes. The campaign ran nationwide on The Trade Desk’s Kokai platform across four channels: CTV, broadcaster video on demand (BVOD), audio and open online video (OLV). It included audio advertising brand lift as part of the combined measurement.

Rather than measuring brand lift through four siloed studies, Happydemics measured all four channels through one omnichannel survey. IP-validated ad recallers were grouped by the combination of channels they saw and compared with a statistically matched group of people who didn’t recall the ads. Three outcomes were tracked through brand perception measurement: brand image, brand preference and consideration.

By the definitions above, this was omnichannel measurement: the campaign’s full channel set, measured together and organised around the person (ad recallers) rather than the channel.

What the results showed

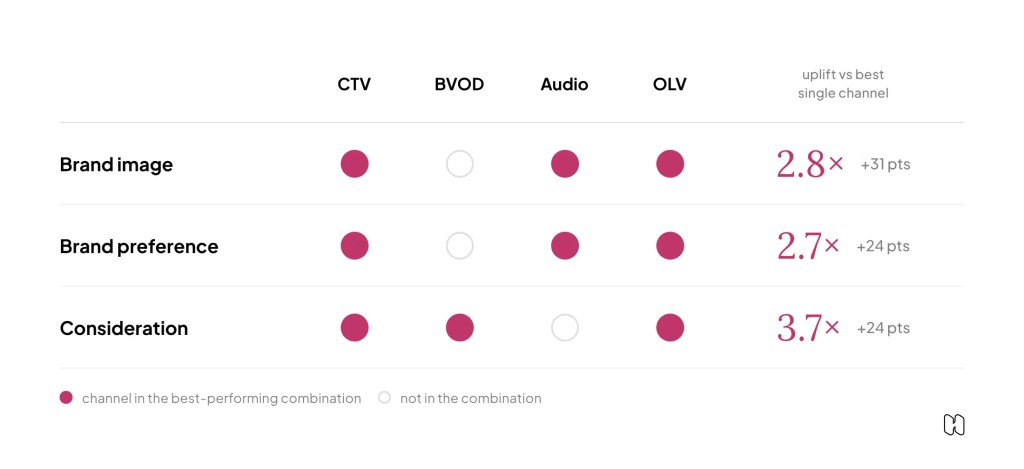
Key finding: In an omnichannel brand lift study run by Happydemics for Disney+ France on The Trade Desk, no single channel combination performed best on every metric. CTV + audio + OLV drove the largest uplift in brand image (+48 points) and brand preference (+38 points), while CTV + BVOD + OLV drove the largest uplift in consideration (+33 points). The best omnichannel mix depends on the brand objective, not on any one channel.

The campaign reached 7.5 million people and 6.8 million households across France, from nearly 17 million impressions. For each objective, the best-performing combination far outpaced the strongest channel on its own:

Objective Best combination Uplift vs. non-recallers Gain over strongest single channel
Brand image
CTV + audio + OLV
+48 pts
+31 pts over OLV alone (2.8×)
Brand preference
CTV + audio + OLV
+38 pts
+24 pts over audio alone (2.7×)
Consideration
CTV + BVOD + OLV
+33 pts
+24 pts over OLV or BVOD alone (3.7×)

Every winning mix beat its best individual channel by at least 24 points. That’s synergy, measured rather than assumed. Because every group was measured against the same matched control, these are like-for-like comparisons. Each gain is calculated against the best-performing simpler setup in the same campaign, not against an empty baseline. The +31 points for brand image is the extra lift CTV and audio added on top of OLV, the strongest channel on its own.

But no single combination won on every metric. CTV and OLV appear in both winning trios; the swing channel is audio for image and preference, and BVOD for consideration. As Lavinia Benon-Stanescu, Data Partnerships Director at The Trade Desk, put it: “There wasn’t one channel combination that won across every brand metric.”

The best channel mix depends entirely on the objective. For Lionel Saguy, Paid Acquisition Senior Manager at Disney+ France, the value was “being able to combine a complex and intelligent setup with a survey to understand exactly the best performing combination.”

For the full breakdown, read the Disney+ case study or The Trade Desk’s write-up.

What this means for planners

Three practical lessons for planners looking to prove campaign impact come out of the data:

  1. Pick the objective before the mix. The combination that did most for brand image and preference was not the one that did most for consideration. A mix tuned for one KPI can leave points on the table for another.
  2. Don’t judge channels on solo performance alone. CTV wasn’t the strongest single channel on any of the three metrics, yet it sits in every winning combination. Some of a channel’s value only shows up in what it does alongside the others.
  3. Measure the way you activate. If the plan is built to work across channels, single-channel lift studies will report on the parts and miss the effect of the whole.

What comes next

The Disney+ study set out to show two things: that channel synergy can be measured rather than assumed, and that the right mix depends on the objective you’re optimising for. Both held.

In Q1 2027, Happydemics launches omnichannel brand lift measurement, bringing the approach behind the Disney+ study to brands planning their 2027 activations. For planners and brand leads, that means one study that tells you not just which channels are working, but which combinations are working, and for which goal. The brand metrics stay the ones you already track. What changes is that the results account for how your channels work together.

If you’re planning omnichannel activations for 2027 and want to know which mix will move your objective, get in touch with our team. In the meantime, read the full Disney+ case study.

Frequently asked questions

What is an omnichannel brand lift?

Omnichannel brand lift measures how much a campaign moves brand metrics such as image, preference and consideration. It covers the full relevant channel mix in one study instead of scoring each channel on its own. That means it can show which channels are working, and also which combinations are working and for which objective.

What’s the difference between multi-channel, cross-channel and omnichannel brand lift?

Multi-channel studies measure each channel on its own, so they can’t see how channels interact. Cross-channel measurement links a selected set of channels and can show whether specific combinations do better than their parts. Omnichannel measurement does the same across the full channel mix. Only cross-channel and omnichannel approaches can detect synergy between channels.

Is there a single best channel mix for brand lift?

No. Happydemics ran an omnichannel study for Disney+ France on The Trade Desk, and no combination won on every metric. CTV + audio + OLV drove the largest uplift in brand image (+48 points) and brand preference (+38 points). CTV + BVOD + OLV drove the largest uplift in consideration (+33 points). The best mix depends on the brand objective.

What is channel synergy in brand lift?

Channel synergy is when a combination of channels delivers more brand impact than any of those channels does alone. In the Disney+ study, every winning combination beat its strongest single channel by at least 24 points. For brand image, CTV + audio + OLV delivered 2.8× the lift of OLV alone, which was the strongest individual channel.

Why can’t separate single-channel brand lift studies measure synergy?

Each single-channel study has its own sample, timing and control group. Put side by side, they can rank channels against each other. They can’t show whether a combination did better than its parts, or by how much. To measure synergy, one survey has to cover every channel, so respondents can be grouped by the combination they saw and compared against the same matched control.

How did Happydemics measure brand lift in the Disney+ campaign?

One omnichannel survey covered CTV, BVOD, audio and OLV. IP-validated ad recallers were grouped by the channel combination they saw. Each group was compared with a statistically matched group of people who didn’t recall the ads. Because the control is based on recall, lift is tied to ads that actually registered, not just ads that were delivered. Results are read against a benchmark of more than 40,000 KPIs.

Why was CTV in every winning combination if it wasn’t the strongest single channel?

Some of a channel’s value only shows up alongside other channels. In the Disney+ study, CTV wasn’t the strongest solo channel on brand image, preference or consideration, yet it was part of every winning combination. Judging channels only on solo performance can undervalue the ones that make the rest of the mix work harder.

How should planners choose a channel mix for brand lift?

Start with the objective. In the Disney+ study, the mix that did most for brand image and preference wasn’t the one that did most for consideration. Then measure the way you activate. If the plan is built to work across channels, the study should be too, or it will report on the parts and miss the effect of the whole.

When is Happydemics launching omnichannel brand lift measurement?

Happydemics launches omnichannel brand lift measurement in Q1 2027, building on the study run with The Trade Desk and Disney+. Brands keep the metrics they already track, and the results also show how their channels work together.


APAC holiday advertising: why December wins attention but loses impact

APAC holiday advertising: why December wins attention but loses impact

Happydemics analysed 1,641 brand lift studies run across 15 APAC markets between May 2021 and September 2026. Of the four regions compared, APAC is the only one whose advertising year peaks in December. And while December campaigns in the region are remembered more than usual, they do less for the brand than campaigns run in any other month.

Elsewhere in the world, that extra December attention turns into stronger brand results. In APAC, the season works at the top of the funnel and stalls below it. For anyone planning APAC holiday advertising, that affects how you plan the season as much as how you judge it afterwards.

About the Data

The analysis draws on Happydemics’ database of brand lift study results for APAC: 1,641 studies run for 67 client organisations across East Asia, Southeast Asia, South Asia and Oceania. Comparisons with the rest of the world draw on between 13,380 and 14,070 campaigns, depending on the metric, and the median APAC campaign ran for 31 days.

Each study compares people exposed to a campaign with a statistically similar control group, so the results capture the incremental effect of the advertising itself. Two measures carry most of the story.

Ad Recall and the Impact Score

People’s ad recall tells you whether they remember seeing the advertising. The Impact Score summarises how a brand lift performed across all of its KPIs at once, on a scale of 0 to 100. Each KPI, such as consideration or brand image, is ranked against comparable campaigns using benchmarks built from media type, industry and market, and the Impact Score is the average of those rankings. When December’s Impact Score falls, December campaigns are ranking lower against their peers on the brand outcomes they were bought to move.

One caveat before the findings: the regional December signal is driven mainly by Japan, and some country readings rest on small samples. Sample sizes appear alongside the numbers throughout.

APAC Runs on a Different Q4 Clock

To compare seasonality, Happydemics indexed the days campaigns were live in each month against each region’s own average month (index 100), using the complete years 2023 to 2025. Western Europe, North America and Latin America all peak in November, around Black Friday. APAC peaks in December, at 175. The index tracks measured campaign activity rather than total ad investment, so the shape of the year matters more than the level.

A one-month gap sounds minor. In practice, it’s enough for a Q4 plan imported from a Western headquarters to land before APAC’s own peak and ease off just as advertising in the region intensifies.

Peaks Vary From Market to Market

The regional curve also hides wide differences between markets. Among the seven APAC markets with at least 40 campaigns, December is the busiest month in four: Japan (index 172), India (200), Singapore (188) and the Philippines, where December activity reaches 279, the most concentrated peak in the region.

Australia, Malaysia and Thailand keep their own clocks. Australia peaks in September (166), Malaysia in July (207) and Thailand in May (221), shortly after Songkran. Malaysia and Thailand also have thin December activity, with only 10 and 6 advertisers respectively live that month.

The practical step is to build the Q4 calendar from the country up. A single regional plan built around Christmas would still miss the peak in three of these seven markets, and one built around Black Friday would miss it in all of them.

December Buys Attention, but Not Brand Impact

The more consequential finding is what December campaigns achieve once they’re live. Comparing December with every other month, while holding country, media, industry, organisation and year constant, December campaigns in APAC gain 2.3 points of ad recall. That’s in line with the rest of the world, where recall rises 2.1 points. The gap opens up on brand impact. Outside APAC, December’s Impact Score rises 1.6 points, while in APAC it falls 2.5 points.

December campaigns in APAC get noticed and remembered, but that attention isn’t carrying through into the brand outcomes advertisers are paying for, such as consideration and brand image.

A Problem That Starts in October

The monthly view, which compares each month with APAC’s annual average, shows how the pattern builds. December is one of the two strongest months of the year for recall and the weakest for brand impact, at 2.4 points below the average month. The weakness doesn’t start at Christmas, either. October and November both sit below average on Impact Score, and October records the lowest recall of the year, 3.1 points under average, just as year-end pressure starts to build.

Two changes follow for planning and reporting. The first is to benchmark December against December. Judged against an annual norm, a campaign that performed well for the season can look like a failure, and a weak one can hide behind strong recall. The second is to treat high recall as the starting point for advertising effectiveness measurement. In December especially, recall confirms the ad was noticed, while whether the brand benefited needs its own measure.

The Regional Average Hides Very Different Decembers

Because the regional December drop is driven mainly by one market, country-level results tell a more useful story than the APAC average.

Japan: Recall Holds, Brand Impact Falls

Japan shows the clearest December drop in the region. Recall holds up at peak volume, but brand impact falls 5.9 points compared with Japan’s other months (49 December campaigns). Christmas and Oshogatsu, the New Year holiday, make December Japan’s busiest month for advertising, so festive visibility is easy to come by. Brand effect is much harder to win.

Australia: December Still Delivers

Australia tells the opposite story. December recall rises 3.0 points and brand impact holds steady (46 December campaigns). The Christmas and Boxing Day period, which coincides with the start of summer, gives brands a natural reason to be part of the conversation.

India: No Penalty, No Premium

India’s December performance doesn’t move in either direction. December is India’s heaviest month by live campaign days (index 200), yet campaigns perform much as they do the rest of the year. With 16 December campaigns, the base is too small to draw firm conclusions from, and in India the timing that matters most is Diwali, which we look at next.

For regional teams, the takeaway is to report December performance with country components and sample sizes next to the APAC figure. A strong Australian result and a weak Japanese one can blend into a regional number that describes neither market.

Diwali Shows Why Recall Alone Can Mislead

Diwali anchors festive season advertising in India, and it offers the clearest example of why strong recall and strong brand outcomes don’t always travel together. To isolate the festival effect, Happydemics compared Indian campaigns running in the five weeks before Diwali, using the actual festival dates from 2021 to 2026, with Indian campaigns at other times of year. That gives 54 campaigns inside the window and 197 outside it.

Inside the window, it’s harder to be seen. Ad recall drops 7.6 points, and attribution, which measures whether people link the ad to the right brand, drops 6.3 points. Brand image slips 2.4 points. Judged on those measures alone, Diwali looks like a poor time to advertise.

Consideration points the other way, rising 3.2 points in the same window. Audiences are harder to reach and less likely to remember who advertised to them, but the people a campaign does reach are readier to buy.

That changes how Diwali campaigns should be briefed and judged. A campaign measured on recall alone would be written off, even if it moved consideration as far as the season allows. The attribution drop is the part to fix: in a crowded festive window, branding has to work harder so the right brand gets the credit.

The Formats Built for Attention Lose the Most Brand Effect

Format-level results show where December clutter does the most damage. The table compares each format’s December performance with the same format in other months across APAC, in points. Share of voice here refers to a format’s share of the campaigns Happydemics measured, not total market spend.

Format Share of voice Ad recall Impact Score
Display
+7.3
+0.3
−5.4
Online video
+0.2
−0.1
−8.3
DOOH (directional)
+1.9
−3.1
−2.0

Source: Happydemics brand lift studies, APAC, May 2021 to September 2026. DOOH is directional only. 

Display and online video lose the most brand impact in December, falling 5.4 and 8.3 points, yet recall for both barely moves. Audiences still see these ads and still remember them, so whatever goes wrong happens after the exposure.

Budget weight doesn’t explain the pattern. Display takes a far larger share of December campaigns than it does in any other month, while online video’s share hardly changes, and online video still loses more brand impact than display.

For media and creative teams, the December priority in attention formats is brand linkage: making sure an ad that’s seen and remembered is also tied to the brand that paid for it.

Spending More Won’t Protect December’s Performance

December also changes who you’re competing with. Across APAC, food and beverages gains 6.6 points of share of voice in December compared with the rest of the year, electronics 3.7 points, cosmetics and skincare 3.1 and luxury 1.3. Tourism gives up 3.4 points and banking 1.0. A brand that leads its category in March can find itself a minor voice in December, so December share-of-voice assumptions need their own baseline.

Crowding in doesn’t predict how a category performs. Food and beverages gains the most share of voice and improves on both recall (+2.4) and Impact Score (+1.8) across 36 December campaigns. Electronics also gains share and recall (+3.0), but its Impact Score falls 10 points (23 campaigns), which is the region’s December pattern at its most extreme. At a broader level, FMCG (44 campaigns) and retail and lifestyle (34) both come through December largely intact on brand impact, at −0.7 and +0.5 points respectively.

What seems to protect performance is relevance to the moment. Food and drink has a natural place in year-end celebrations, and Australia’s festive summer gives brands a reason to speak. That’s an interpretation more than a rule, and electronics, a common gift category that still loses ground, shows it isn’t the whole explanation. It still makes a useful test for any December brief: does this creative have a clear reason to exist in this market, at this moment?

Three Things Worth Testing in Your Next Q4 Campaign

The data shows where December falls short, but it doesn’t yet prove what fixes it. Happydemics frames the following as hypotheses to test, each tied to a signal in the data.

Tighter Audience Focus

An early signal across 84 campaigns suggests that in December, extra reach no longer buys extra recall. The test is whether concentrating weight on audiences already in market for the category lifts consideration more than buying additional reach.

More Distinctive Branding

With several categories crowding in and attribution falling 6.3 points during Diwali, it’s harder for an ad to be credited to the right brand at year end. The test is whether stronger, earlier branding improves attribution, and whether formats that stand apart from the festive clutter help further. To measure creative impact on brand metrics, compare those outcomes across executions.

Clearer Commercial Messaging

At Diwali, consideration rises even as recall falls, a sign that audiences are readier to buy. The test is whether product-led creative with a clear offer turns that readiness into stronger brand outcomes.

Whichever you test, read results market by market and against a December baseline instead of the annual average. Measuring while campaigns are live helps too. In a festive window only a few weeks long, a result that arrives after the campaign ends can only inform next year’s plan.

APAC Q4 Planning: A Market-by-Market Cheat Sheet

For the seven markets with enough data, here’s where each one peaks and what to plan for. Performance reads compare December with the same market’s other months, and the table flags where only activity data is available.

Market Seasonal peak (index) What the data shows Planning implication
Japan
December (172)
Recall holds, brand impact falls 5.9 pts (49 December campaigns)
Don’t equate festive visibility with brand effectiveness
Australia
September (166)
Recall up 3.0 pts, brand impact holds (46 December campaigns)
December can still be productive
India
December (200), with Diwali from late October to mid November
Diwali window: recall −7.6 pts, consideration +3.2 pts (54 campaigns). December base too small to read (16)
Plan around Diwali and judge it on more than recall
Philippines
December (279)
The region’s most concentrated December (activity data only)
Expect heavy clutter
Singapore
December (188)
Festive activity split across Lunar New Year, Deepavali and Christmas (activity data only)
Avoid planning around a single period
Malaysia
July (207)
Activity data only; December performance not reported.
Don’t import a December peak
Thailand
May (221)
Activity data only; December performance not reported.
Plan around Songkran, not Christmas

Source: Happydemics brand lift database. Seasonal peak is the busiest month by campaign days. Index 100 = the market’s average month (2023 to 2025). The index reflects campaign activity measured by Happydemics, not total advertising spend.

Measuring Holiday Campaigns With an Independent Partner

To prove campaign impact, it is essential to separate what the advertising did from what was already happening in a market. Happydemics helps brands by measuring brand lift and supporting better-informed campaign decisions. It compares people exposed to a campaign with a statistically similar control group, using non-incentivised, panel-free surveys, so results reflect how real audiences respond.

Benchmarks covering more than 80,000 data points across 13 channels put each result in context against comparable campaigns by market, media type and industry. For teams running APAC holiday advertising, that makes it possible to judge December on its own terms and, with in-flight measurement, to see brand results while campaigns are still running and adjust inside the festive window.

Discover how Happydemics helps brands measure the real impact of their holiday campaigns across APAC through independent brand lift studies.

Find out more

Using Brand lift to measure brand awareness

Using Brand lift to measure brand awareness

Most teams judge it through share of voice, social mentions, branded search or a quarterly tracker that lands weeks after the flight.

None of these brand awareness measures is wrong, but most are proxies. They describe signals that travel with awareness, not awareness itself, and few can show what your advertising actually changed in a person’s mind.

What Is Brand Awareness, and Why Is It Hard to Measure?

Brand awareness is the share of your target audience that knows your brand and links it to its category. It is a core upper-funnel KPI and feeds what the Ehrenberg-Bass Institute calls mental availability: the likelihood a brand comes to mind at the moment of purchase.

The distinction between brand recognition vs brand awareness matters here: recognition means identifying a brand from a cue such as its logo, while brand recall means retrieving it with no cue, which we cover in our guide to brand recall in advertising.

Because awareness lives in people’s heads, it is often inferred from behaviour and media signals, which is cheap, quick and indirect, or asked about directly, which has, in the past, been traditionally expensive, and slow.

How Brand Awareness Is Typically Measured

Most answers to “how can brand awareness be measured?” fall into seven methods, each useful, none complete on its own.

Aided and unaided awareness surveys

The right method in principle: to know whether people know a brand, ask them. In practice, incentivised panels, samples too small to detect a few points of movement and results that arrive weeks after the flight weaken the read.

Share of voice

Share of voice compares your media presence with competitors’ and tracks with market share over time. But it measures what you put out, not what audiences took in.

Social listening and mention volume

Social listening captures conversation, not awareness, and is skewed by a vocal minority and existing fans. Mentions are easy to count and hard to defend, so treat them as directional.

Branded search volume

Branded search is real behaviour, so it is more credible than mentions. But it also responds to paid search, PR, news and seasonality, so you rarely know how much of a rise the campaign caused.

Website traffic and direct visits

Direct visits are easy to pull from analytics but confounded by everything else marketing does, and they only capture the few aware people who choose to visit.

Platform-reported brand lift

Platform studies use an ad recalling or exposed-versus-control design, a real step up. But each covers only its own inventory, uses its own methodology and is run by the company selling the media, so results cannot be compared across a plan.

Brand tracking studies

Trackers are the best tool for long-term awareness trends. But they sample the whole market, including people who never saw your ads, so a campaign’s effect is diluted, and a monthly or quarterly cadence is too slow for live decisions.

Third-party cross-channel brand lift studies

Independent studies measure brand lift across media using a consistent methodology, making channels comparable through cross-platform advertising measurement. Non-incentivised surveys can track awareness, recall and consideration during and after campaigns, but results still depend on sampling quality and how exposure is established.

Why These Methods Fall Short on Their Own

The common thread: most brand awareness measures describe a state, not a change caused by advertising. Awareness moves with competitors, PR, word of mouth, seasonality and past campaigns. Without separating people who saw the campaign from people who did not, you are reading correlations. The same gap runs through perception metrics, as we explain in our guide to brand perception measurement.

To prove campaign impact on awareness, you need one comparison: what people who saw the ads know, versus a comparable group of people who did not. That method is brand lift.

Why Brand Lift Is an Ideal Brand Awareness Metric

Brand lift compares an audience that states they recall seeing an ad, or are identified as exposed to advertising, with a matched audience that was not, and measures the difference in lift for brand KPIs. Because ad recall or exposure is the only systematic difference, the gap is the incremental lift the campaign caused.

That is exactly the awareness question that measuring brand lift addresses: did the campaign leave more people knowing the brand than would have otherwise? Awareness lift is the ad recalling group’s awareness minus the control group, in percentage points. A brand lift study captures it three ways:

  • Unaided awareness lift: more people naming the brand spontaneously. The hardest KPI to move and the clearest sign of growing mental availability.
  • Aided awareness lift: more people recognising the brand from a list. More sensitive for launches and challenger brands.
  • Ad recall lift: more people remembering the advertising itself, the precondition for the other two.

Because the same methodology and questions apply in every channel, brand lift gives one comparable awareness metric across every channel measured, including CTV, social, online video, audio, pDOOH and more.

Why the Right Approach to Brand Lift Matters

Not all brand lift is equal. Four choices determine the quality of an awareness read.

Panel-free, in-context responses

Professional panellists answering for incentives tend to claim familiarity with more brands than they know. In a 2013 study, up to 19% of respondents claimed awareness of three or more brands that do not exist (Quirk’s). Overclaiming inflates aided awareness in both groups and hides real lift, and Kantar reports that researchers discard an average of 38% of survey data over quality concerns (Kantar). Brand lift companies like Happydemics remove the panel layer: responses come from real people, in context, through non-incentivised surveys.

Cross-channel benchmarks that are comparable

Happydemics’ database holds 60,000+ benchmarks across 13 channels (CTV, DOOH, in-game, display, digital video, digital audio, influencer, social ads, cinema, radio, OOH, press and TV) in 100+ countries, all on one methodology. For ctv ad measurement, a 5-point aided awareness lift can be read against DOOH, and against your category norm.

Independent of the platforms being measured

Platform-reported lift is the platform marking its own homework, and the platforms most invested in proving awareness lift are the ones selling awareness inventory. Independent brand lift applies one methodology across everything it measures.

In-flight measurement for awareness campaigns

Where creative, channel weighting or audience targeting can still change, Happydemics’ in-flight brand lift shows awareness moving while the campaign runs. In our data, a majority of final results take shape in the first days, so an early read can redirect budget before most of it is spent (and possibly wasted).

Turning Brand Awareness Into a Measurable Outcome

Most brand awareness measures are proxies: they infer a campaign-driven change in what people know, think and feel. Third party brand lift, using a matched vs control methodology,  closes that gap by comparing real human responses, isolating the true incremental brand awareness your advertising created.

Ready to measure the awareness your campaigns actually create? Talk to the Happydemics team about independent, cross-channel brand lift, or see how in-flight measurement works.

How to get real time Brand lift insights for In-Flight campaigns

How to get real time Brand lift insights for In-Flight campaigns

Asking a person what they actually thought of the advertising has stayed almost exactly where it was: a survey fielded at the end, a report weeks later, a deck that lands when the budget is spent.

So the industry optimised on what it could measure rather than on what it wanted to know. Clicks, viewability, completion rates, last-touch attribution. Every one of them is a guess at human response, never the response itself. A completed view is not a changed mind. A click is not an intention to buy.

That was a tolerable trade when media plans were locked for a quarter. It is an expensive one now, because of what has been put in charge of the optimisation. The risk with AI-driven planning and buying is not that it fails. It is that it succeeds, brilliantly, at the wrong thing. Give an engine a click target and it will find you the cheapest clicks in the market, from people who were never going to buy. Give it completion rate and it will find the environments where ads are hardest to skip. It will hit the number faster and more ruthlessly than any human team. It does not know your proxy is a proxy.

The fix is not slower automation. It is a better target: independent, people-based brand impact, arriving quickly enough to steer the campaign that is still running. That is what in-flight brand lift does.

What is in-flight brand lift?

In-flight brand lift is the continuous measurement of brand lift KPIs while a campaign is live: ad recall, awareness lift, consideration lift, brand perception and message association, read throughout the flight rather than after it — the same core practice of measuring brand lift, just on a faster clock.

The science is unchanged. A brand lift study compares an ad recalling group with a matched control group and reports the gap between them. That gap is the incremental lift attributable to the campaign. In-flight measurement keeps ad recalling vs control intact; what changes is the cadence of collection and reporting.

It is worth separating this from the “real time” metrics the buying platforms already show you. Those are engagement signals — impressions, views, clicks, completion — reported by the same platform selling the media. Useful for delivery. They are not independent measures of brand impact, and they answer a different question.

In-flight brand lift vs traditional brand lift studies

A traditional brand lift study is a post-mortem. Field the survey at the end, weight the data, write the report, present it weeks after the flight closed. Genuinely useful for the next campaign. Useless for this one.

In-flight brand lift collects from launch and produces rolling reads across the flight. Teams see directional movement early, watch confidence firm up as sample builds, and refine while spend is still in market. Same underlying methodology, different reporting rhythm. The distinction matters because the usual objection to real-time measurement is that speed costs rigour. It does not. Nothing about the experiment design is relaxed; the data simply stops sitting in a queue.

Why real time brand lift matters for in-flight campaigns

The traditional model trains teams to learn lessons for next time rather than this time. Closing the feedback loop during the flight changes three things.

Optimising campaigns while they are still live

This is the headline use case. When you can see which creative, channel or audience is actually moving perception, you can act on it: rotate out the execution that is not landing, shift weight toward the placements producing lift, tighten targeting, cap frequency where returns flatten, pause what is not working.

Without in-flight data, those same decisions get made on engagement proxies. The cheapest impressions and the most persuasive impressions are frequently not the same impressions, and CTR will never tell you which is which.

Proving value earlier in the flight

Brand budgets are defended in front of finance teams and clients who want evidence, not a promise that the wrap deck will be encouraging. A rolling read gives you directional brand impact while there is still time and budget to build on it.

That matters most in the moment a campaign needs to justify continued or increased investment mid-flight. “We will know in six weeks” is not an argument. A live consideration lift, with a widening ad recalling vs control gap, is. That’s the kind of evidence a proper campaign roi analysis needs to make its case.

Learning faster across creatives, channels and audiences

Continuous measurement turns every live campaign into a test environment. Creative variants, channel mixes and audience segments can be compared against each other on brand lift rather than engagement — the comparison that actually reflects the objective.

The compounding effect is the real prize. Learnings arrive while the next brief is being written, not months after planning has closed.

How real time brand lift measurement actually works

Three mechanics do the work.

Continuous collection from ad recalling and control groups. Surveys are served throughout the flight, not in a burst at the end. The ad recalling group has genuinely been served the campaign; the control group has not, but is otherwise matched on demographics, market and media propensity. A control group that is systematically lighter on media will quietly inflate every result you report, so how exposure is identified and how the control is matched should always be explicit.

Rolling reads on core KPIs. Ad recall, awareness, consideration, brand perception and message association are recomputed as responses accumulate, producing a time series rather than a single average. That distinction has teeth: a campaign that hit its awareness target in week two and flatlined, and one that climbed steadily to the same endpoint, produce identical post-campaign numbers and demand opposite decisions.

Statistical thresholds that tighten over time. Early in the flight, confidence intervals are wide and movement is directional. As sample builds, differences become significant. The discipline is knowing which stage you are at — and pre-registering your KPIs and decision thresholds before launch, so you are testing a hypothesis rather than fishing in noise.

Because the method asks people rather than tracking them,it applies the same way across digital, social, video, CTV, audio, retail media and OOH — with ctv ad measurement as demanding a discipline as any other channel — which makes cross-channel measurement a genuine comparison rather than an apples-to-oranges exercise.

What marketers can actually do with in-flight brand lift insights

  • Creative optimisation. Rotate toward the variant showing stronger lift on the KPI that matters — the best recall driver and the best consideration driver are often not the same asset.
  • Channel and placement optimisation. Move budget toward the channels and placements delivering measurable brand impact, and pause the ones delivering impressions only.
  • Audience optimisation. Identify the segments responding most strongly and lean into them while there is budget left to lean with.
  • Frequency and pacing. Read lift against exposure frequency to find where additional impressions stop moving perception, and redeploy everything beyond that point.
  • Message correction. If you are buying “premium” and the ad recalling group is lifting on “affordable”, that is a creative brief problem you can fix mid-flight.
  • Stakeholder reporting. Give leadership and clients a live view of brand impact rather than a media delivery report.

One caution: brand perception moves on a slower clock than a bid. Change one substantial variable at a time, and resist treating a two-point wobble as a crisis.

Common misconceptions about real time brand lift

“Real time means less rigorous.” The ad recalling vs control design is unchanged. Only the reporting cadence is different.

“The platforms already report this.” They report engagement signals, and they are not independent of the media being measured. When platform-reported lift and an independent partner’s read diverge, that gap is the reason.

“It is just a post-campaign report delivered earlier.” No. It is a continuous read designed to be acted on, which is a different product with a different purpose.

“You need a huge budget to act on it.” Modest adjustments — rotating creative, pausing a weak placement — produce disproportionate gains precisely because they are informed by brand impact rather than engagement proxies.

Getting real time brand lift insights with Happydemics

Happydemics has always measured brand lift the same way: independent of the platforms being measured, people-based, ad recalling vs control, across every channel in the plan. In-flight measurement is an extension of that methodology, not a separate product line. The rigour is identical. The delivery is continuous.

The practical effect is that creatives, audiences and channels can be compared live, on brand impact, by a partner with no stake in which of them wins.

From post-mortem to live input

In-flight brand lift changes what measurement is for. It stops being a verdict delivered after the fact and becomes an input to the decisions being made today — both for optimisation, changing the campaign while it is running, and for proof, demonstrating value before the flight ends.

Every other part of the machine already runs at that speed. The only question is whether the target you hand it is a proxy or the real thing.

Discover how Happydemics delivers real time brand lift insights to optimise your campaigns in-flight.

How to Get Mid-Campaign Impact Insights

How to Get Mid-Campaign Impact Insights

Teams optimise delivery in hours and learn about brand impact weeks after the campaign has ended.

That gap has real costs.

Weak creative keeps running, high performing channels remain underfunded and budget is reallocated without evidence of brand impact. Post-campaign learnings may improve the next wave, but they cannot influence the campaign still in market.


The industry data confirms how wide the gap has become. Campaign activation is increasingly automated, but measurement is struggling to operate at the same speed: 2026 research from the WFA and Ebiquity found that only 13% of advertisers rate themselves as strong at moving quickly from data to insight. The tools are fast. The media is fast. The insight is not.

Which raises the question: can you actually measure brand outcomes while a campaign is still live? Increasingly, the answer is yes.

What are mid-campaign insights?

Mid-campaign brand insights are continuous, in-flight readings of how a live campaign is shifting brand outcomes; awareness, ad recall, consumer perception, consideration, preference, and purchase intent — captured while the campaign is still running, from real people who recall seeing it: ad recallers.

The terminology varies. You’ll see the same idea described as mid-flight brand impact insights, in-flight campaign measurement, or real-time brand measurement. The promise is the same: brand evidence that arrives early enough to influence live spend.

It’s worth being precise about what brand insights are not, because several adjacent things get conflated with them:

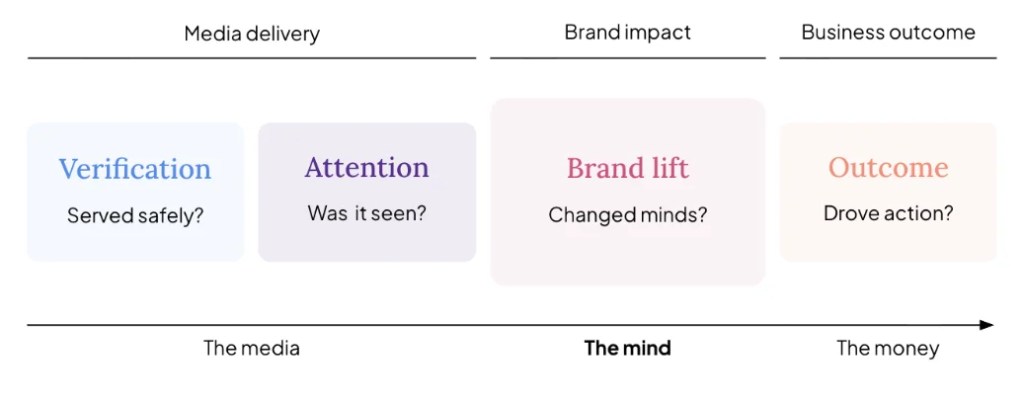
They are not delivery metrics. Impressions, viewability, verification and attention are genuinely real-time, but they tell you whether the campaign was served and seen, not whether it worked. Delivery is a prerequisite for brand impact, not a proxy for it.

They are not actions like sales, footfall or conversions. Those outcomes matter, but they are also shaped by factors beyond advertising.

Mid-campaign brand insights sit earlier in the journey, showing whether a campaign is changing what people know, feel and intend before those shifts translate into behaviour.

One more clarification matters: “mid-campaign” does not need to mean “instantaneous.” A weekly measurement cadence is often entirely sufficient to drive meaningful mid-flight optimisation.

Across Happydemics in-flight studies, the first response comes in as little as 24 hours after media exposure. From there, a statistically reliable read on core KPIs emerges once just 30% of responses are collected, with insights refreshed daily as new data comes in.

Why Mid-Campaign Brand Measurement Has Historically Been Hard

If in-flight brand measurement is so useful, why hasn’t it been standard practice? It isn’t for lack of investment. Eight in ten advertisers already use brand lift studies. The challenge is turning findings into decisions quickly enough to influence live campaigns. And confidence in existing approaches is fragile: IAB’s State of Data 2026 research, found that at least 60% of buy-side users say advanced measurement approaches fall short on timeliness.

That scepticism is well-founded, because three genuine problems stood in the way of mid-campaign brand measurement.

The first was a sample problem. Credible brand lift measurement depends on comparing a meaningful sample of ad recallers (people who recall seeing the campaign) against a comparable control group who don’t. Traditional survey fielding simply couldn’t assemble those samples quickly enough. By the time you had statistically usable groups, the campaign window had moved on — so measurement waited until the end, when the full sample was available.

The second was a methodology problem. Brand lift studies were designed around fixed campaign windows: field before or during, read out after. The architecture assumed one measurement moment, not a continuous series of them.

The third was an action problem. Even when early signals technically existed, reporting cycles buried it. Data went through processing, analysis, and deck-building, and insights surfaced weeks later…at which point they were history lessons, not decision inputs.

Each of these constraints has loosened and the barriers that made in-flight brand measurement impractical have, quietly, come down.

Why Brand Lift Is the Right Framework for Mid-Campaign Insights

Real-time signals can show whether people saw, clicked or completed an ad. They cannot tell you whether the campaign changed their minds.

Brand lift can. By comparing ad recallers with a control group of non-recallers, it isolates the campaign’s incremental effect real human responses including awareness, perception, consideration, preference and purchase intent.

That full-funnel view matters because brand outcomes do not always move together. A campaign may build awareness without strengthening consideration, or drive recall without improving preference. Brand lift reveals those gaps while there is still time to respond.

Because the same framework applies across channels, teams can compare brand impact consistently and see where the next pound of budget can work hardest.

In short, brand lift is the only direct, people-based way to see how a campaign is changing minds while it is still live.

What You Can Actually Do With Mid-Campaign Insights

The value of in-flight measurement is best understood through the decisions it enables. Mid-campaign optimisation isn’t one activity but several, and real-time insights into campaign performance feed each of them differently. Five use cases come up again and again.

Creative comparison and rotation. When multiple creatives are live, mid-campaign brand insights show which variants are actually moving brand outcomes, not just which are earning clicks. If one execution is driving recall and another is flat, you can shift weighting towards the performer weeks before a post-campaign report would have told you the same thing, after the fact.

Tip: the first few days of a campaign can be highly revealing. If ad recall sits five or more points below benchmark at the first in-flight reading — and creative KPIs such as interest and likeability are also weak — the issue is usually the creative itself and a rotation may be needed.

Channel mix rebalancing. In-flight measurement reveals which channels are driving the brand outcome you’re targeting. If CTV is lifting consideration while another channel is delivering impressions but little else, budget can be reallocated while the spend is still live — turning measurement into an active input to media planning rather than a retrospective audit of it.

Tip: when one channel posts an Impact Score of 60+ and leads the next-best channel by 15 points across multiple KPIs, it’s time to reassess the media mix. First, though, separate true channel strength from creative fit — the two often overlap.

Audience and targeting refinement. Campaigns rarely move every segment equally. Mid-flight read-outs identify where the campaign is genuinely shifting perception and where it’s falling flat, allowing targeting to be tightened — or a struggling segment’s messaging to be rethought — during the campaign window.

Market and geo comparison. For multi-market campaigns, in-flight insights show where the campaign is landing and where it isn’t. That might prompt heavier investment in a responsive market, or a localised creative adjustment in one that’s lagging, without waiting for the global wrap-up.

KPI re-prioritisation. Sometimes the signal isn’t about media at all, but messaging. If awareness is climbing but consideration isn’t following, the campaign is getting seen without giving people a reason to care — a cue to adjust the message mid-flight rather than discovering the disconnect in the post-mortem.

Tip: the same disconnect can surface in likeability: if people remember the ad but don’t enjoy it, the messaging tone, complexity or execution may be holding it back. Brand KPI data shows that Clarity and Likeability are 86% correlated. A confusing ad is rarely a liked one, and weak scores on both are a cue to reconsider messaging mid-flight.

What This Looks Like in Practice

Lenovo leveraged mid-campaign brand insights during its recent Yoga Aura Edition campaign in Sweden, using Happydemics new In-Flight measurement across social, online video and DOOH.

With the first results available by day six, the team removed an underperforming audience segment, turning the campaign around from below benchmark. Mid-campaign insights also reveleased room to extend online video after interest reached seven points above benchmark.

The campaign went from an average projected outcome to delivering a DOOH Impact Score of 64, consideration 11 points above benchmark and a 40.4-point uplift in Brand Image among ad recallers.

These were not recommendations saved for the next campaign. They were decisions made while the current one was still live.

When Mid-Campaign Insights Make the Most Difference

In-flight measurement is most valuable when there is enough campaign runway to act on the signal.

It works particularly well for long duration campaigns, where teams can make a change and observe what happens next. It is also well suited to multi-creative and multi-channel campaigns, where comparison is the engine of optimisation.

The value increases further during high-stakes moments like Lenovo’s FIFA world cup campaign, when uncertainty is high and the cost of discovering a problem after the fact is greatest.

For a very short tactical burst, such as a one-week promotional flight, a well-designed post-campaign brand lift study may be the better fit.


Mid-Campaign Insights as a Competitive Advantage

For the organisations that adopt them, mid-campaign brand insights compound into a genuine edge. And the bar is lower than it might appear. Only 15% currently say effectiveness evidence is the primary driver of budget decisions. Most budget-setting still runs ahead of, or apart from, the evidence on advertising effectiveness. Closing that gap is the advantage: campaigns get optimised faster, while spend is still live and can still be redirected. Less budget is wasted on underperforming creatives and channels, because underperformance is caught in weeks rather than diagnosed in retrospect. Creative learning happens during the campaign — feeding the work that’s live now, not just the brief for next year. And media teams, insight teams, and leadership operate from a shared, credible view of brand performance throughout the campaign window, rather than negotiating between delivery dashboards and gut feel until the wrap report lands.

How Happydemics Mid-Campaign Brand Insights work

Happydemics In-Flight is deliberately simple, activated in one click during brand lift study setup, with data collection running continuously and results updating throughout the campaign. More than 20 brand KPIs, spanning familiarity, recall, perception, consideration, preference and purchase intent, are measured and benchmarked so performance can be compared across creatives, channels, audiences, markets and strategies.

Happydemics In-Flight uses the same ad recaller-versus-control design as a standard brand lift study, preserving the credibility of the final measurement in every interim reading,  complementing post-campaign measurement rather than replacing it.

For advertisers already optimising media in real time, continuing to measure brand impact retrospectively no longer makes sense. The opportunity is not simply to learn faster, but to act while budget, creative and targeting can still be changed, and while those decisions can still improve the campaign.

For more information on how in-flight works, book a demo with the Happydemics team.